Janet Yellen jobs lies, Obama lies, Media lies, Yellen employment growth strong and touts stated unemployment rate, Gallup CEO Jim Clifton correct, Dictionary states lie is anything that gives or is meant to give a false impression
“There’s no other way to say this. The official unemployment rate, which cruelly overlooks the suffering of the long-term and often permanently unemployed as well as the depressingly underemployed, amounts to a Big Lie.”…Gallup CEO Jim Clifton
“In February 2015 there were 43,000 fewer white Americans employed, 354,000 more not in the labor force, 96,000 more employed and we added 295,000 jobs? Was Common Core math used?”…Citizen Wells
“Freedom is the freedom to say that two plus two make four. If that is granted, all else follows.”…George Orwell, “1984″
Two people with vast knowledge of US employment have made statements in the past several years.
Keith Hall ran the Bureau of Labor Statistics from 2008 to 2012.
From the Atlanta Journal Constitution August 5, 2013.
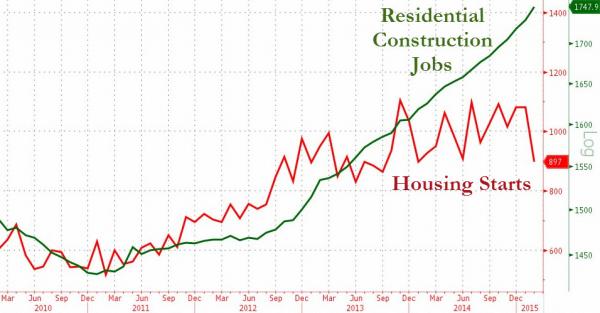
“The July government employment report released Friday showed the job market treading water.”And a closer look at one of the two measures the Labor Department uses to gauge employment suggests that part-time work accounted for almost all the job growth that’s been reported over the past six months. …” ‘Over the last six months, of the net job creation, 97 percent of that is part-time work,’ said Keith Hall, a senior researcher at George Mason University’s Mercatus Center. ‘That is really remarkable.’”
Read more:
http://www.ajc.com/weblogs/kyle-wingfield/2013/aug/05/obamacare-economy-35-part-time-jobs-every-new-full/
Jim Clifton is the CEO of Gallup.
From Gallup February 3, 2015.
“The Big Lie: 5.6% Unemployment”
“Here’s something that many Americans — including some of the smartest and most educated among us — don’t know: The official unemployment rate, as reported by the U.S. Department of Labor, is extremely misleading.
Right now, we’re hearing much celebrating from the media, the White House and Wall Street about how unemployment is “down” to 5.6%. The cheerleading for this number is deafening. The media loves a comeback story, the White House wants to score political points and Wall Street would like you to stay in the market.
None of them will tell you this: If you, a family member or anyone is unemployed and has subsequently given up on finding a job — if you are so hopelessly out of work that you’ve stopped looking over the past four weeks — the Department of Labor doesn’t count you as unemployed. That’s right. While you are as unemployed as one can possibly be, and tragically may never find work again, you are not counted in the figure we see relentlessly in the news — currently 5.6%. Right now, as many as 30 million Americans are either out of work or severely underemployed. Trust me, the vast majority of them aren’t throwing parties to toast “falling” unemployment.
There’s another reason why the official rate is misleading. Say you’re an out-of-work engineer or healthcare worker or construction worker or retail manager: If you perform a minimum of one hour of work in a week and are paid at least $20 — maybe someone pays you to mow their lawn — you’re not officially counted as unemployed in the much-reported 5.6%. Few Americans know this.
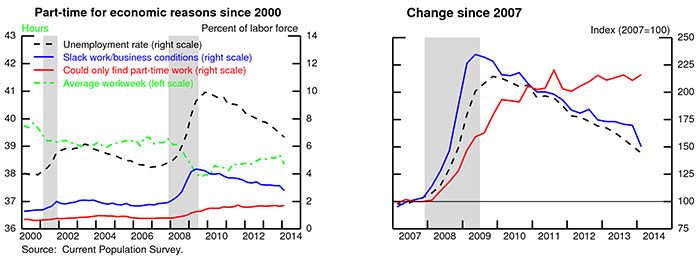
Yet another figure of importance that doesn’t get much press: those working part time but wanting full-time work. If you have a degree in chemistry or math and are working 10 hours part time because it is all you can find — in other words, you are severely underemployed — the government doesn’t count you in the 5.6%. Few Americans know this.
There’s no other way to say this. The official unemployment rate, which cruelly overlooks the suffering of the long-term and often permanently unemployed as well as the depressingly underemployed, amounts to a Big Lie.
And it’s a lie that has consequences, because the great American dream is to have a good job, and in recent years, America has failed to deliver that dream more than it has at any time in recent memory. A good job is an individual’s primary identity, their very self-worth, their dignity — it establishes the relationship they have with their friends, community and country. When we fail to deliver a good job that fits a citizen’s talents, training and experience, we are failing the great American dream.”
Read more:
http://www.gallup.com/opinion/chairman/181469/big-lie-unemployment.aspx
Jim Clifton was attacked and ridiculed.
But Clifton was correct.
Websters New World College Dictionary
“The official dictionary of the Associated Press”
Lie definition (noun)
“anything that gives or is meant to give a false impression.”
So why does Janet Yellen, Obama the liar in chief and the media continue to tout the “low” unemployment rate.
It is a big lie!!!
Janet Yellen in her FOMC presentation repeatedly referred to the “low” unemployment rate in the context of strong employment growth as well as the number of “jobs” being added.
“We have seen continued progress toward our objective of maximum employment. The pace of employment growth has remained strong, with job gains averaging nearly 290,000 per month over the past three months. The unemployment rate was 5.5 percent in February; that’s three-tenths lower than the latest reading available at the time of our December meeting.”
Click to access FOMCpresconf20150318.pdf
Obama has a long well documented tradition of lying.
The mainstream media is controlled by Big Brother Obama.
So why is Yellen lying?
Let’s examine US employment in the short term and over Obama’s 6 year tenure.
All of this data can be found at the US Labor Dept. BLS site.
The latest report was for February 2015.
The Labor Dept. reported 295,000 jobs added.
However, there was only a 96,000 gain in employment.
And Whites had 43,000 fewer employments!
There were 354,000 more people not in the labor force!
There were 180,000 more people not in the labor force who want a job now!
Does Yellen consider this strong employment growth?
That does not even cover new entrants into the labor force.
Remember, there are approx. 4 million people turning 16 each year in the US. This is from people living here and does not count illegals.
From Obama’s first 6 years.
5,205,000 full time employments were lost during the first year of Obama’s occupation of the White House from January 2009 to January 2010?
2.8 million white Americans fewer were employed during Obama’s first year.
During Obama’s term, from January 2009 to now, 75 percent of the employment went to Hispanics/Latinos.
Read more:
https://citizenwells.wordpress.com/2015/03/18/janet-yellen-fomc-press-conference-march-18-2015-pace-of-employment-growth-has-remained-strong-continued-progress-toward-maximum-employment-of-whom-illegal-aliens-job-gains-averaging-nearly-290k/
What about people losing their job?
Averaging 300,000 initial claims each week seems to be a victory to those in government and the media.
From Zero Hedge March 19, 2015.
“After some ‘stability’ in the last few weeks, initial jobless claims in the major shale states has started to rise again with Texas the most impacted for now. Overall initial jobless claims rose very modestly to 291k, but leaves the 4-week average above 300k for the 2nd week in a row – the first time in over 6 months.”
http://www.zerohedge.com/news/2015-03-19/initial-claims-hold-worst-levels-6-months-shale-state-joblessness-re-surges
I have been concerned for some time that we are not getting the full impact of these numbers.
From the BLS.
Unemployment insurance (UI) programs are administered at the state level and provide assistance to jobless people who are looking for work. Statistics on the insured unemployed in the United States are collected as a by-product of state UI programs. Workers who lose their jobs may file applications to determine if they are eligible for UI assistance. These applications are referred to as “initial claims.” Claimants who meet the eligibility requirements must file “continuing claims” for each week that they seek benefits.
Data on initial and continuing UI claims are maintained by the Employment and Training Administration, an agency of the U.S. Department of Labor, and are available on the Internet at http://workforcesecurity.doleta.gov/unemploy/claims.asp.
While the UI claims data provide useful information, they are not used to measure total unemployment because they exclude several important groups. To begin with, not all workers are covered by UI programs. For example, self-employed workers, unpaid family workers, workers in certain not-for-profit organizations, and several other small (primarily seasonal) worker categories are not covered.
In addition, the insured unemployed exclude the following:
- Unemployed workers who have exhausted their benefits.
- Unemployed workers who have not yet earned benefit rights (such as new entrants or reentrants to the labor force).
- Disqualified workers whose unemployment is considered to have resulted from their own actions rather than from economic conditions; for example, a worker fired for misconduct on the job.
- Otherwise eligible unemployed persons who do not file for benefits.
Because of these and other limitations, statistics on insured unemployment cannot be used as a measure of total unemployment in the United States. Indeed, over the past decade, only about one-third of the total unemployed, on average, received regular UI benefits.”
http://www.bls.gov/cps/cps_htgm.htm
The number of people who have lost jobs and in some cases fallen by the wayside may be much higher than we thought.
I hope to report more on this soon.
I know that the mainstream media is not reporting this.
Are Rush Limbaugh, Sean Hannity, Glenn Beck or your favorite talk radio host reporting these facts?
Let me know.